 Selbständig machen in nur 90 Tagen – Jetzt kostenlos testen!
Reading time: 5 minutes
Processing time: 30 minutes
Today we’re moving away from purely financial key figures to talk about key figures that indicate whether you’re on the right track to your business idea implementation.
Here is your task for today:
In the following, I will present you with various key figures that illustrate your business idea’s development. Think about the target values you need to achieve with the key figures to have a sustainable business model. In this way, you’ll always know later whether you’re approaching your goal as planned and if not, why not.
Write the key figures relevant to your business and your goals per key figure on a Post-it and stick them in your Extended Canvas.
Customer acquisition costs
As soon as you start making money, you have to make sure that it doesn’t cost too much to attract new customers. To measure your customer acquisition costs, use the following formula:
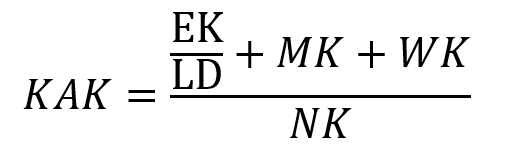
Where the abbreviations stand for the following:
KAK = customer acquisition costs
EK = development costs
LD = lifetime of the product in months
MK = marketing costs per month
WK = maintenance costs per month
NK = number of new customers per month
Before you get real data from your business, you have to estimate the various costs. In addition, use empirical values that you google on the Internet to check your estimates’ plausibility.
Customer acquisition costs can change over time as you introduce new products and services, improve your processes, etc. Therefore, you must check later on whether your customer acquisition costs are within the estimated or planned range.
Customer loyalty
Customer retention is a decisive success factor, as it’s much more expensive to win a new customer (customer acquisition costs) than to continue to serve an existing one. Therefore, you should measure how long customers stay with you and how often they come back. This gives you important information about the quality and uniqueness of your offer.
Viral range
The viral reach indicates how well your business model is integrated via social media such as Facebook, Instagram, LinkedIn, and Twitter. Social media is a powerful advertising channel when used properly. Unless you happen to be an expert in social media marketing yourself, you’ll probably outsource this task. This is a vast field and explaining this in detail would go beyond this program’s scope.
Churn rate
The churn rate indicates how quickly you lose customers. When used as an internal metric, sales must be evaluated to see if it’s an expected natural part of the development of your independence or a sign of a deeper problem.
Revenue and income
Revenue is the key variable to check whether your business is thriving. Profit is the key indicator to check whether you’re earning enough from your business to be able to run it sustainably. It typically takes a few months or even years until a business is big enough to not only cover the (initial) investments and running costs but also to make a profit. Therefore, it’s very important to estimate and plan these key figures so that you’ll notice early on if the business doesn’t develop as hoped and needed.